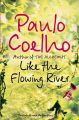
 Like the Flowing River: Thoughts and Reflections
Автор: Пауло Коэльо
Год издания:
A breathtaking collection of reflections from one of the world's best loved storytellers, Paulo Coelho.In this riveting collection of thoughts and stories, Paulo Coelho, the author of ‘The Alchemist’, offers his personal reflections on a wide range of subjects from archery and music to elegance, traveling and the nature of good and evil.An old woman explains to her grandson how a mere pencil can show him the path to happiness…instructions on how to climb a mountain reveal the secret to making your dreams a reality…the story of Ghengis Khan and the Falcon that teaches about the folly of anger – and the art of friendship…a pianist who performs an example in fulfilling your destiny…the author learns three important lessons when he goes to the rescue of a man in the street – Paulo shows us how life has lessons for us in the greatest, smallest and most unusual of experiences.‘Like the Flowing River’ includes jewel-like fables, packed with meaning and retold in Coelho's inimitable style. Sharing his thoughts on spirituality, life and ethics, Paulo touches you with his philosophy and invites you to go on an exciting journey of your own.
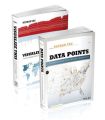 FlowingData.com Data Visualization Set
Автор: Nathan Yau
Год издания:
Visualize This is a guide on how to visualize and tell stories with data, providing practical design tips complemented with step-by-step tutorials. It begins with a description of the huge growth of data and visualization in industry, news, and gov't and opportunities for those who tell stories with data. Logically it moves on to actual stories in data-statistical ones with trends and human stories. the technical part comes up quickly with how to gather, parse and format data with Python, R, Excel, Google docs, etc and details tools to visualize data-native graphics for the Web like ActionScript, Flash libraries, PHP, JavaScript, CSS, HTML. Every chapter provides an example as well. Patterns over time and kinds of data charts are followed by proportions, chart types and examples. Next, examples and descriptions of outliers and how to show them, different kinds of maps, how to guide your readers and explain the data «in the visualization». The book ends with a value-add appendix on graphical perception. Data Points focuses on the approach to visualization and data. Visualization is a medium that can be used as a tool, art, a way to tell stories, etc., Data Points guides readers through making data approachable through visualization techniques and best practices. The focus is on designing with a purpose in mind. Data Points discusses why recipes (from the rules) work and expands on how readers can make their own recipes. The book is example-driven, featuring work from people in areas of art, design, business, statistics, computer science, cartography, and online media, as well as many of the author's own illustrations. The major sections of the book cover: Visualization as Medium – In the same way not all movies are documentaries, not all visualization is about optimal visual perception. Data Representation – There are rules across all visualization applications, such as the use of appropriate shapes to accurately represent values. Design with Purpose – Rules can be broken though. It all depends on who and what you're designing for. Data Points digs deep into the foundations of data visualization: Understanding Data and Visualization Representing Data Exploring Data Visually Designing for an Audience Visualizing with Clarity Putting Everything Into Practice with Tools and Resources